Hits vs. Contacts in Baseball
@Ben Marrow
Growing up, I always founds the notion of "hits" in baseball to be a curious statistic. A player who hits a deep ball directly to a center fielder will fly out, but a player who hits an equally deep ball 100 feet to the fielder's left will get a hit. Since this precise placement appears (largely) beyond the batter's control, it seemed that hits captured a lot of randomness that did not reflect on a batter's ability to make contact with a pitch.
Over time, I became slightly more sympathetic to the hit statistic for two reasons. The first is that if the incidence of hits conditional on balls-in-play is truly random, then variation in hits is an unbiased estimate of variation in contact. Insofar as we only care about relative rankings rather than absolute levels — and given a sufficiently large sample — hits are then a perfectly adequate measure of a batter's ability to hit a ball. Second, I gradually came to understand that contact with the ball is more likely to result in a hit if the batter hits the ball squarely (i.e., as intended), and so better players will obtain more hits.
Of course, these two explanations are somewhat at odds with one another: the first holds that contact is a sufficient statistic for the ability of the player, while the second says we're better off using hits directly. And while the ability of a player is fundamentally untestable, what we can look at is whether the incidence of hits conditional on contact is indeed random.
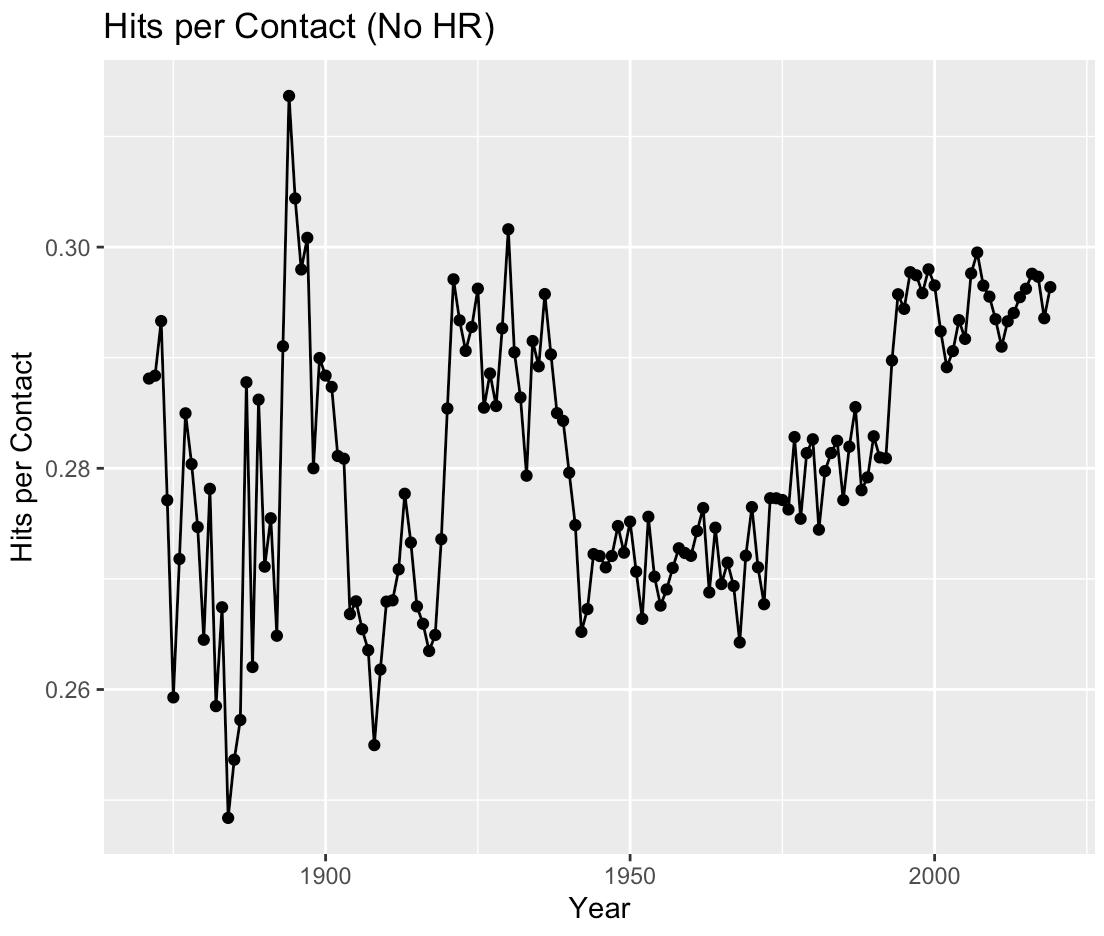
Anyway, here's one chart showing the number of hits per contact over time.
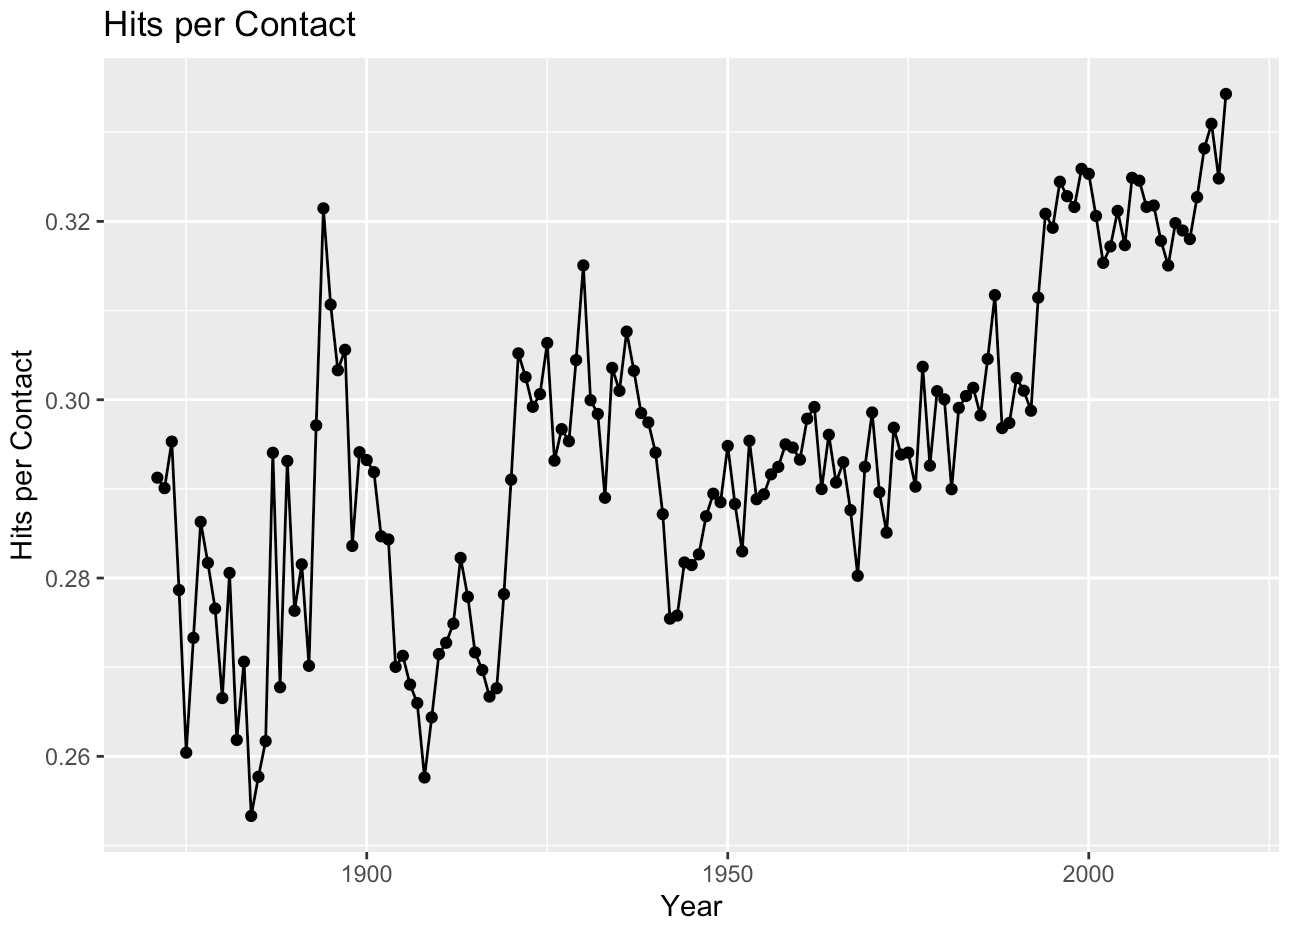
where hits per contact is defined as
Somewhat surprisingly, it's trended up, fairly steadily, suggesting thats hits are not as random as I might have expected. Players have become more efficient over time at converting contact with a ball into a base hit.
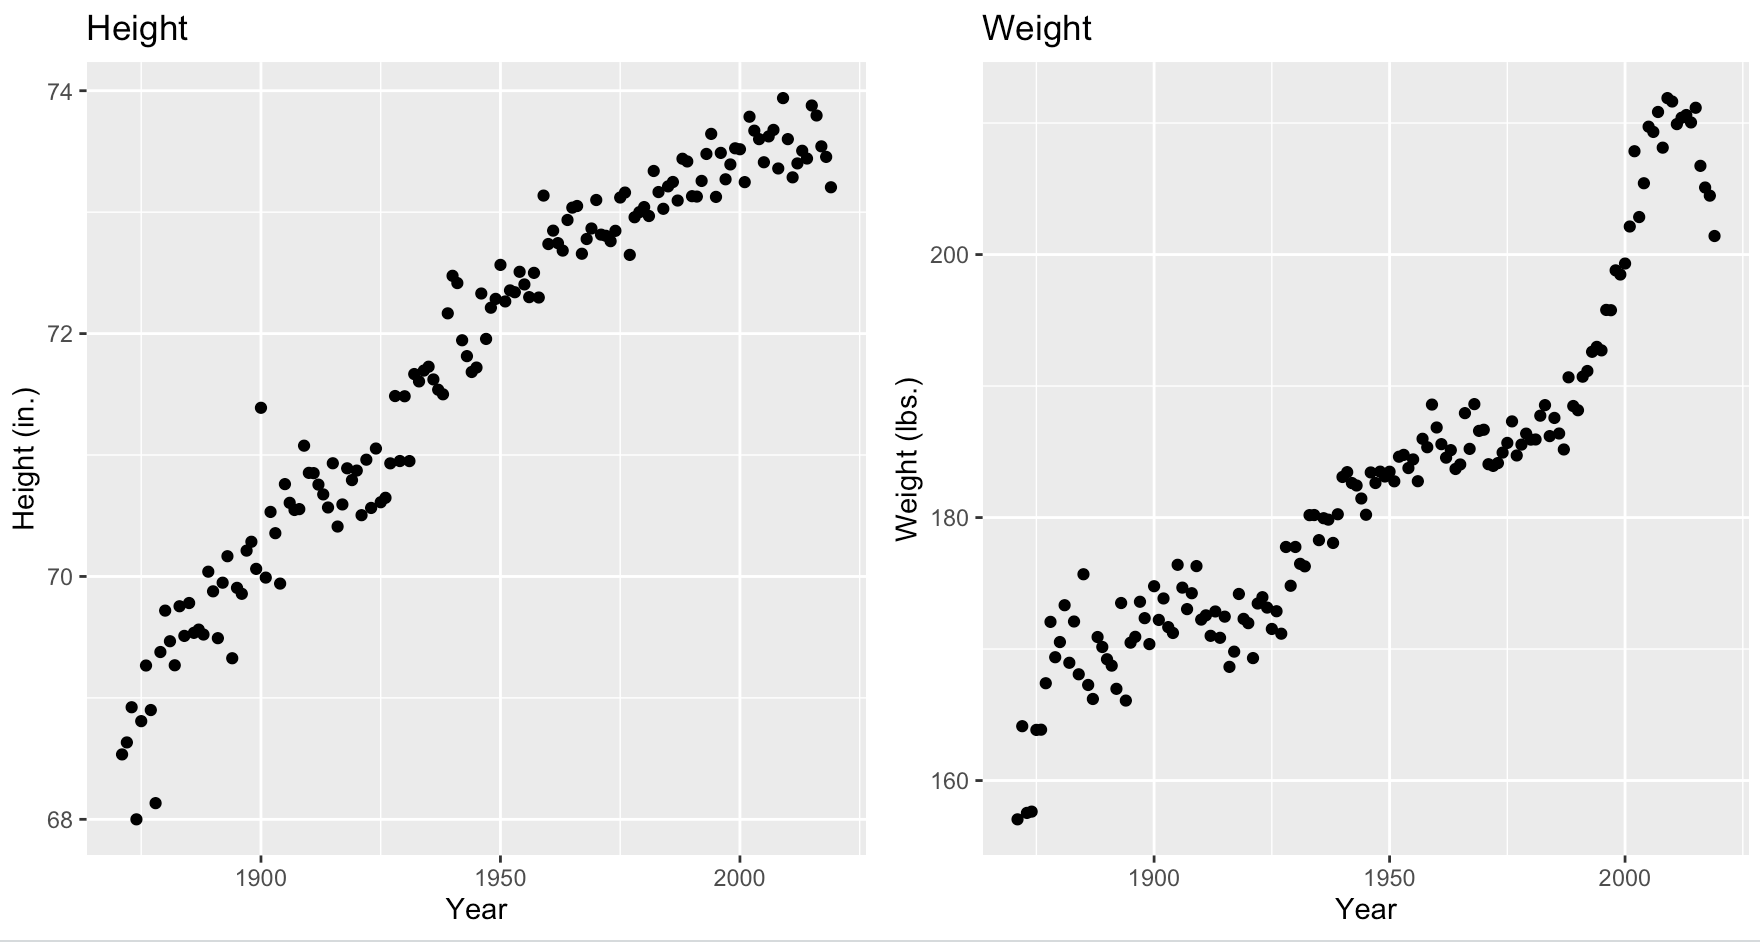
One can tell a number of stories for what's going on here. One account, suggested by a friend, is that exit velocities have increased. If exit velocities are higher, balls-in-play are harder to field, harder to track down, or more likely to leave the park — all of which translate into higher hits per contact. Though I don't have data on exit velocities directly, the average baseball player has gotten taller and heavier over time with a presumably commensurate increase in swing velocity.
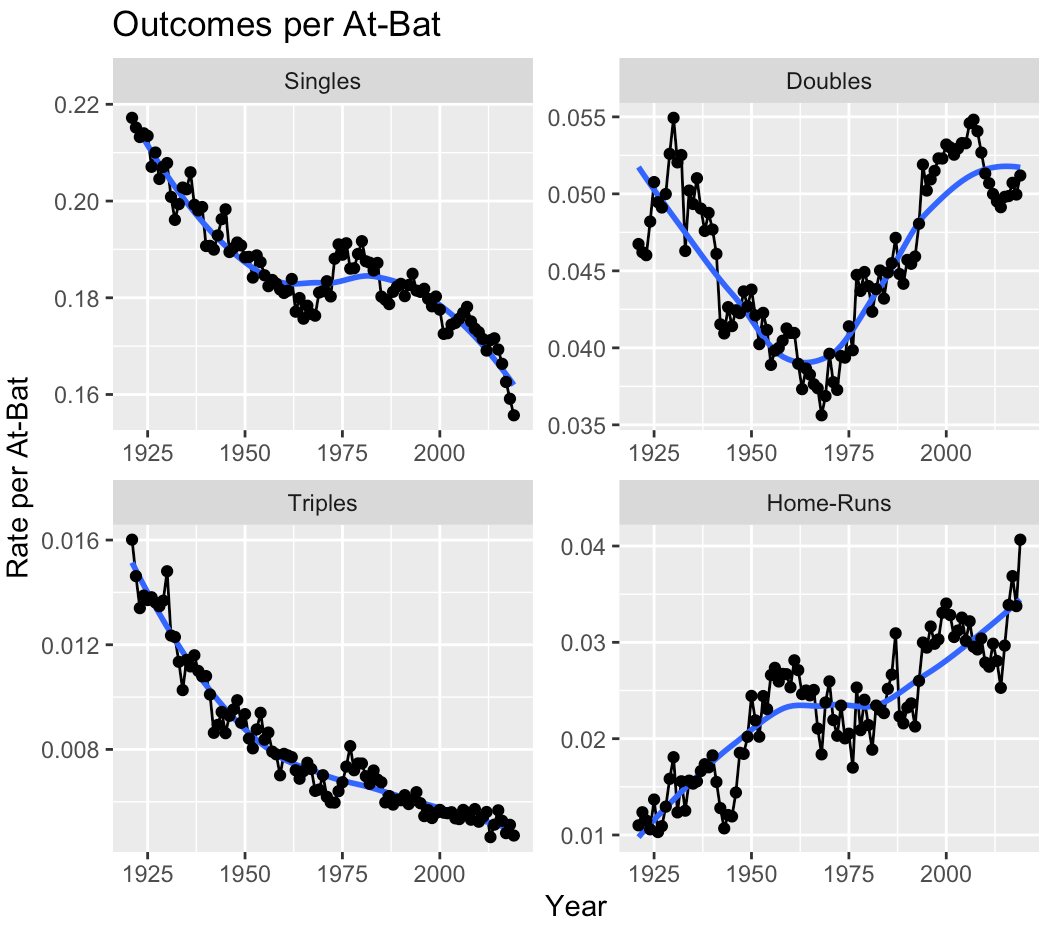
We can also look directly at the increasing frequency of home runs and doubles, suggesting that batters are hitting more powerfully (triples are more about baserunning than power).
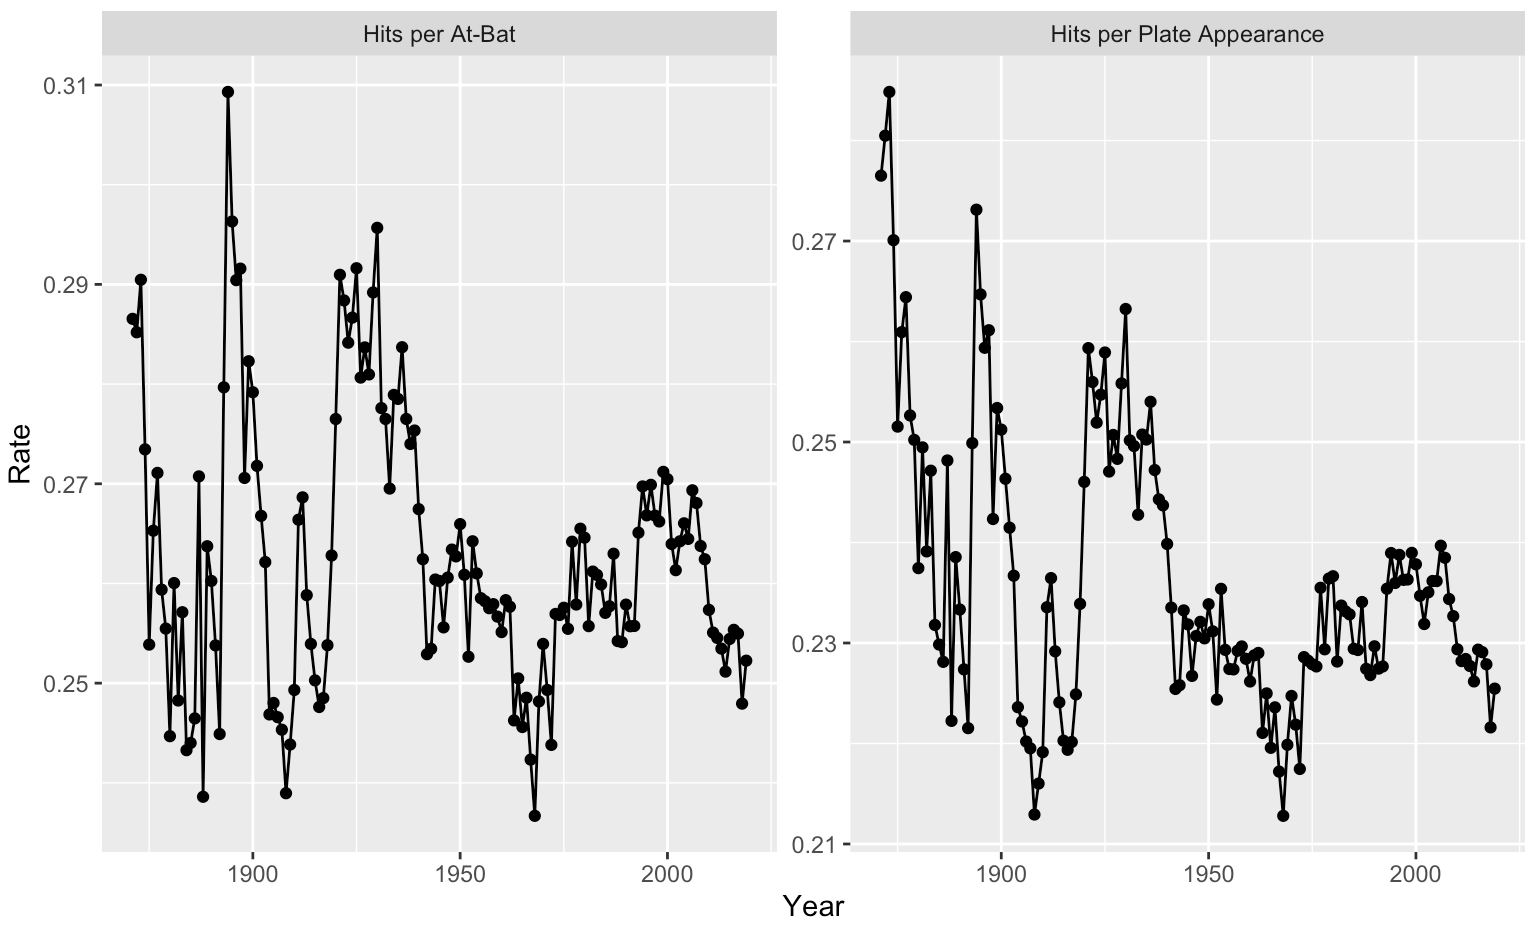
Another (not exclusive story) is that players have become more disciplined and discriminate at the plate. If players only swing at pitches in their comfort zone, then each contact is more likely to be clean, and so more likely to be a hit as well. However, hits per at-bat and hits per plate appearance are both down:
There are many other stories to tell. Maybe fielding has gotten worse, as teams select heavily on batting advantage over ability in the field. Maybe the rise in multi-purposes stadiums in the 60's and 70's, with artificial turf, larger foul territories, and shorter outfields made base hits more likely. Maybe the rise in home-run rates mechanically raises the hits-per-contact. Maybe players are less aggressive in their base running (suggested by decrease in triples).
But I don't find these alternate explanations as compelling. For example, even omitting home runs from our calculation does not change the upward trend in hits per contact (at least post 1950).
It's worth commenting, briefly, on a similar statistic, namely, batting average on balls-in-play (BABIP):
BABIP is similar to hits per contact but it excludes homeruns and adjusts for sacrifice flies. I don't particularly care for either of these adjustments, since both home runs and sac flies — which usually require clean contact — should be included in our measure of efficiency.
Rankings
Since statistics are ultimately about ranking players, a natural follow-up question is whether we can rank players by their efficiency, i.e. by their hits per contact. It is first important to establish whether players have control over this metric at all: for all we know the players with the highest efficiency were simply lucky.
If this were the case, then we would expect efficiency to be fairly uncorrelated year-over-year at the player level (see my previous post for a deeper meditation on predictability in sabermetrics). To the contrary we see positive correlations at all observed lags. This suggests that high seasonal hits-per-contact are not entirely flukes, but rather are related to time-invariant batter qualities.
Hits-per-Contact Autocorrelations
| # Lags | Autocorr. (Equal Weighted) | Autocorr. (PA Weighted) |
|---|---|---|
| 1 | 0.361 | 0.402 |
| 2 | 0.322 | 0.345 |
| 3 | 0.284 | 0.3 |
In the final two tables, I present the rankings of the highest hits-per-contact for at the career and season level, for players with greater than 1000 plate appearances (career) and 200 plate appearances (season) respectively. Familiar names abound, but what's striking is Babe Ruth's presence in a crowd of millennials — another piece of evidence of how good Ruth was for his time.
Most Efficient Players - Career
| Ranking | Debut | Player | Hits per Contact | Contact per PA | PAs |
|---|---|---|---|---|---|
| 1 | 2016 | Judge, Aaron | 0.437 | 0.515 | 1,717 |
| 2 | 2015 | Sano, Miguel | 0.416 | 0.512 | 2,051 |
| 3 | 2011 | Trout, Mike | 0.405 | 0.62 | 5,272 |
| 4 | 2016 | Moncada, Yoan | 0.404 | 0.588 | 1,460 |
| 5 | 2014 | Santana, Domingo | 0.403 | 0.564 | 1,833 |
| 6 | 2016 | Story, Trevor | 0.403 | 0.617 | 2,282 |
| 7 | 2018 | Acuna, Ronald | 0.402 | 0.627 | 1,199 |
| 8 | 1914 | Ruth, Babe | 0.4 | 0.676 | 10,616 |
| 9 | 2011 | Martinez, J. D. | 0.397 | 0.665 | 4,421 |
| 10 | 2011 | Goldschmidt, Paul | 0.395 | 0.63 | 5,379 |
Most Efficient Players - Single Season
| Ranking | Player | Season | Hits per Contact | Contact per PA | PAs |
|---|---|---|---|---|---|
| 1 | Ruth, Babe | 1923 | 0.475 | 0.618 | 699 |
| 2 | Gallo, Joey | 2019 | 0.473 | 0.434 | 297 |
| 3 | Ramirez, Manny | 2000 | 0.472 | 0.613 | 532 |
| 4 | Tatis, Fernando | 2019 | 0.467 | 0.61 | 372 |
| 5 | Sano, Miguel | 2015 | 0.463 | 0.484 | 335 |
| 6 | Hiura, Keston | 2019 | 0.457 | 0.598 | 348 |
| 7 | Judge, Aaron | 2017 | 0.456 | 0.499 | 678 |
| 8 | O'Neill, Tip | 1887 | 0.453 | 0.869 | 572 |
| 9 | Ruth, Babe | 1920 | 0.45 | 0.621 | 615 |
| 10 | McGwire, Mark | 2000 | 0.45 | 0.498 | 321 |
It is worth emphasizing just how restrictive this measure of efficiency is. A batter who swings for the fences on every pitch — resulting in either a strikeout or a home run — will have a high efficiency rating in this metric, but wouldn't be a particularly efficient player overall. Trevor Story, Joey Gallo, Miguel Sano and Aaron Judge for example, all of whom appear in the top 10 for career hits per contact, are also above the 99th percentile for strikeouts per plate appearance.
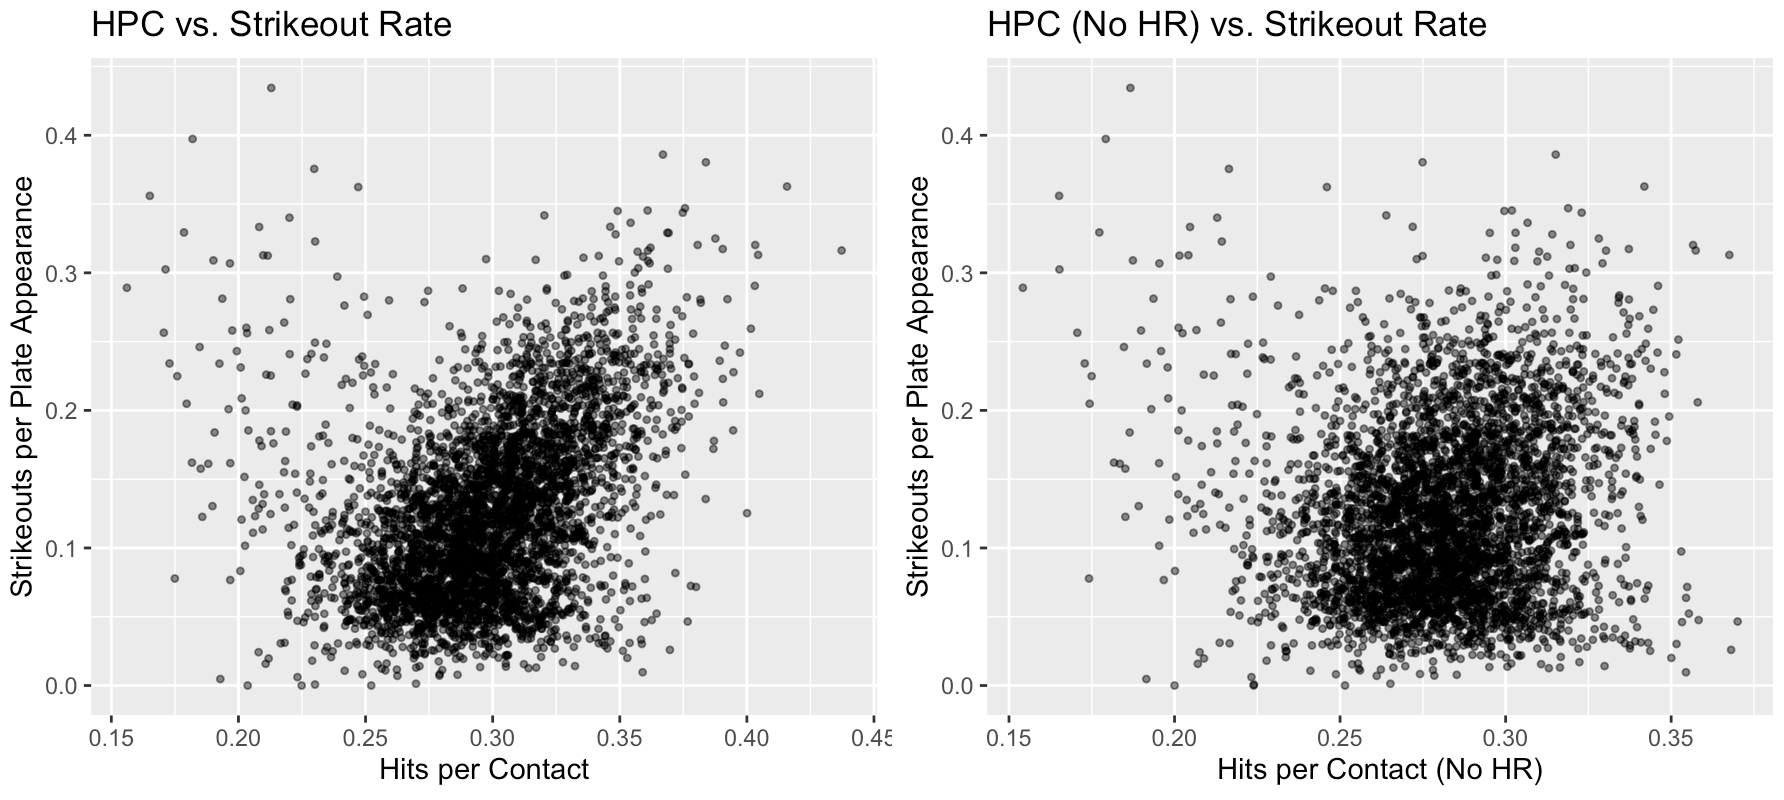
But it is wrong to suggest we are only measuring tendency to swing for the fences. If we adjust our measure of hits per contact to omit homeruns:
Judge, Sano, and Story still rank in the top percentile (Gallo, shockingly, drops to the 39th percentile in this metric). Plotting strikeouts per plate appearance against HPR and adjusted HPR, we see that the correlation drops significantly when we omit home runs.
(Note that If we were to go one step further, and adjust for strikeouts as well by adding back strikeouts to the denominator, we're effectively back to measuring hits per at-bat, i.e. batting average.)
What about the least efficient players? Unsurprisingly, they were virtually all pitchers, mostly from the 50's through 70's. To avoid shaming them (and to give myself a break from coding), I'll hold off on listing them here.